Dam levels
The City of Cape Town and the National Department of Water and Sanitation measures dam levels to check how much water is available for the region and whether water restrictions are necessary for residents and businesses. The dam levels are critical for Cape Town’s water supply.
Daily levels
The dams in and around Cape Town form part of the Western Cape Water Supply System, which is an integrated and collectively managed system of dams, pump stations, pipelines, and tunnels. In addition to servicing Cape Town, the system supplies water to towns in the Overberg, Boland, West Coast, and Swartland areas, and provides irrigation water for agriculture.
See the reading for 7 August 2026.
Weekly levels
See the reading for the week 3 August 2026.
You can also track how much water we have in our main dams supplying our city, compared to this day last week and this day last year. To see a year-on-year comparison, please see
our extended weekly water report.
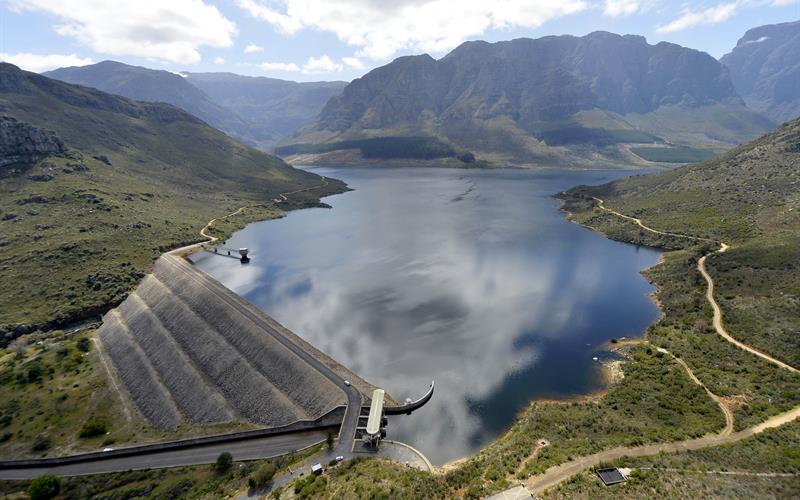
Wemmershoek Dam - 25 September 2018
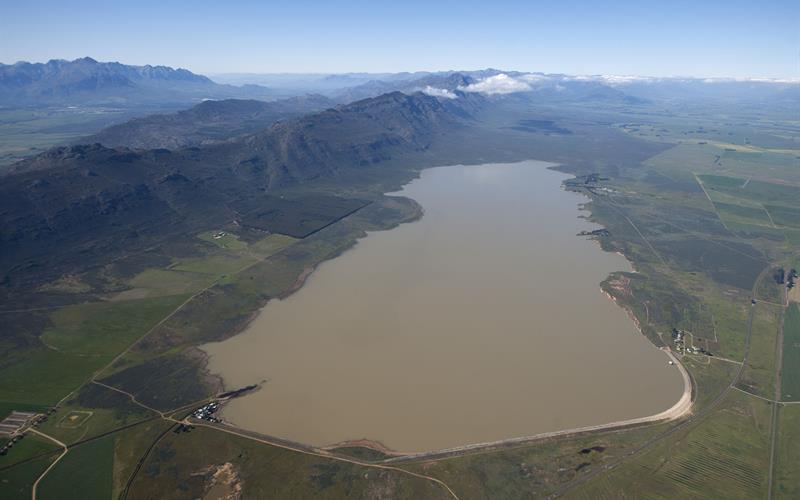
Voelvlei Dam - 25 September 2018
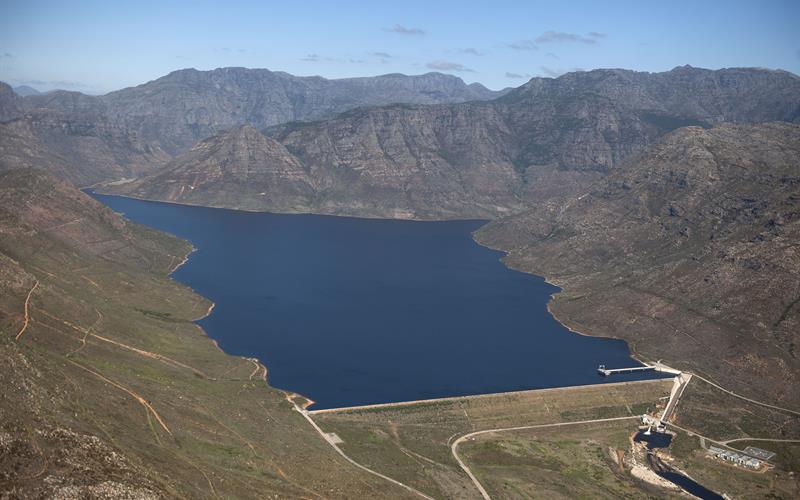
Berg River Dam - 25 September 2018
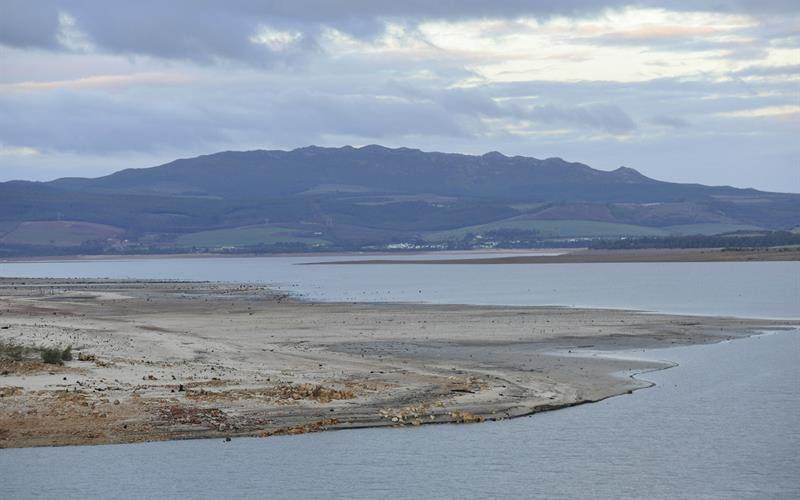
Theewaterskloof Dam - 8 July 2017
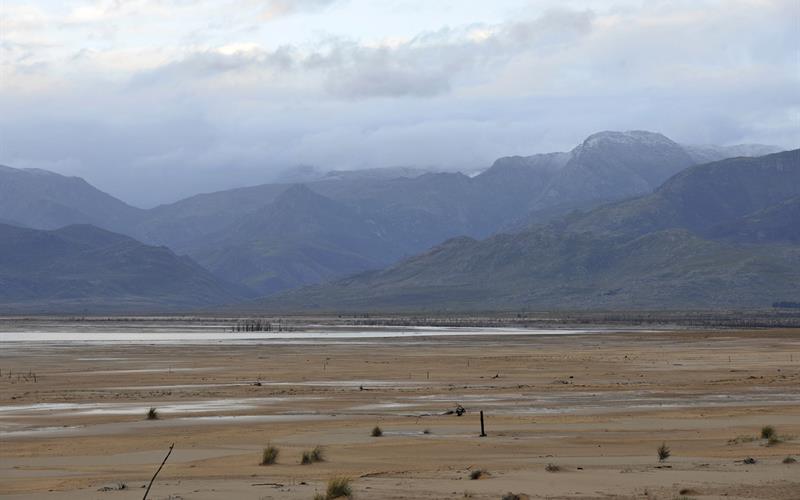
Theewaterskloof Dam - 8 July 2017
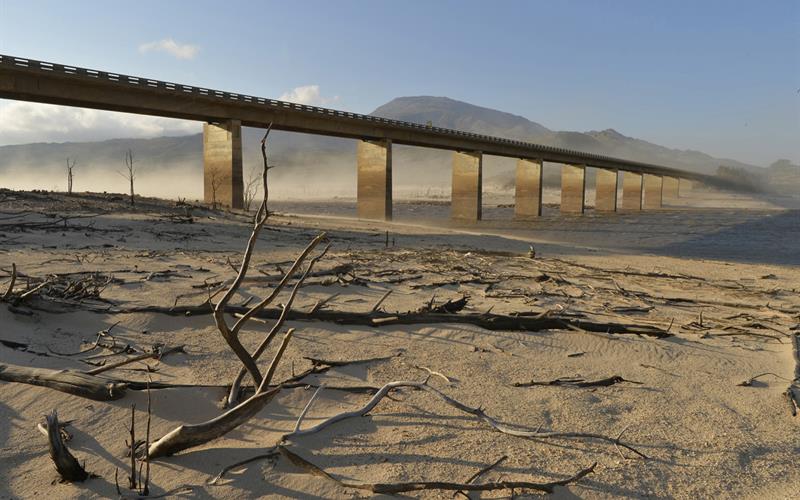
Theewaterskloof Dam - 8 July 2017
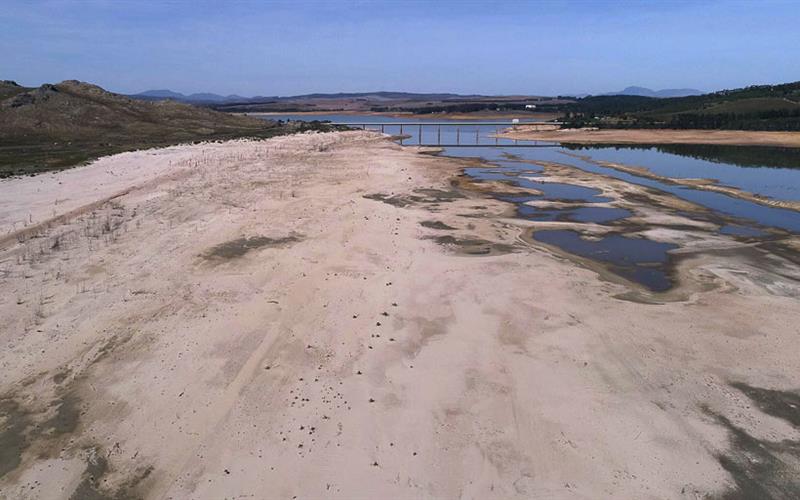
Theewaterskloof Dam - 28 April 2017
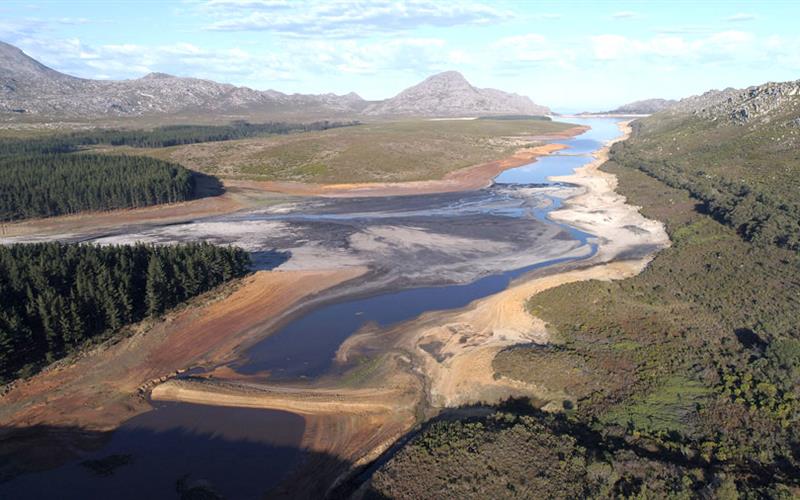
Steenbras Dam - 27 April 2017
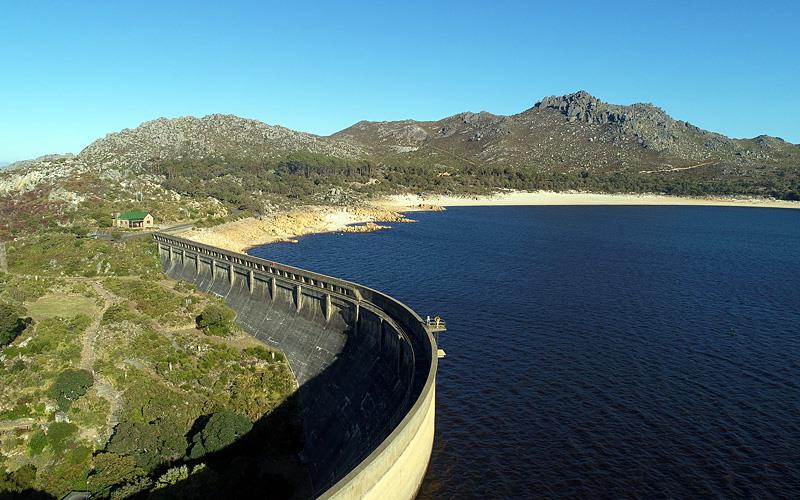
Steenbras Dam - 16 February 2017
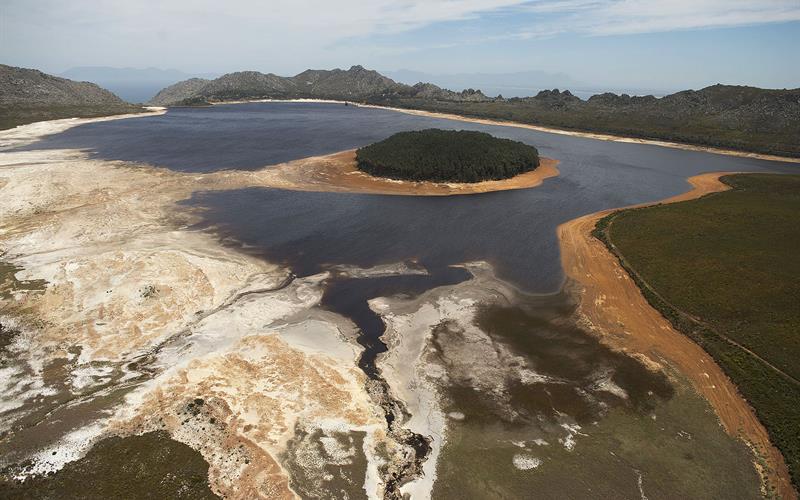
Steenbras Dam - 29 November 2016
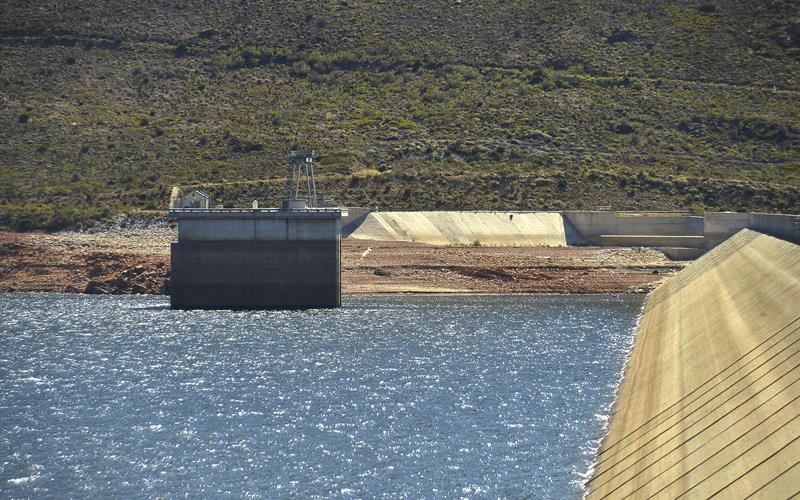
Berg River Dam - 22 November 2016
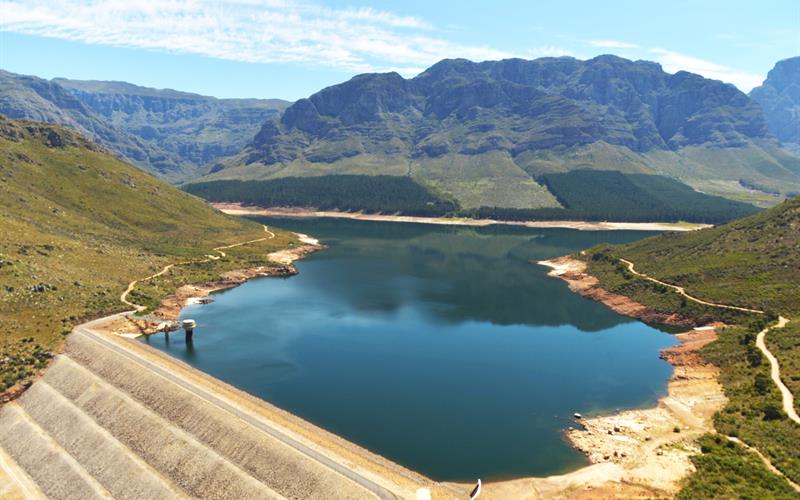
Wemmershoek Dam - 11 November 2016
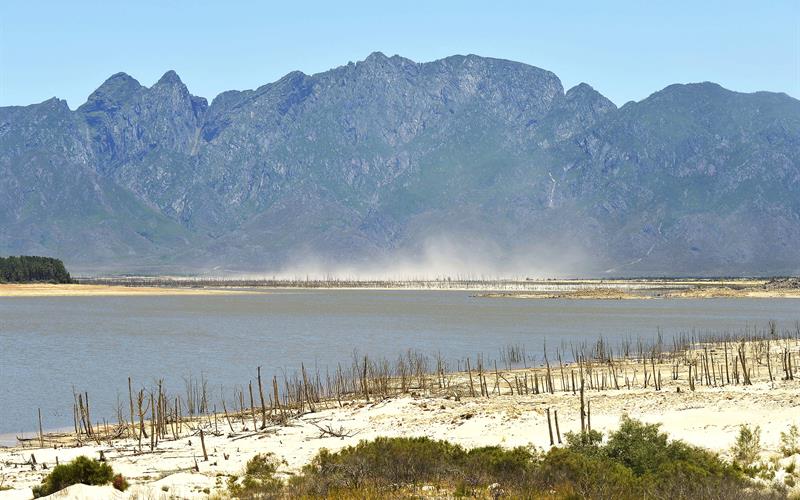
Theewaterskloof Dam - 9 August 2016
Wemmershoek Dam - 25 September 2018
If you would like to find out about dam levels in the rest of the Western Cape or the rest of South Africa, visit the
National Department of Water and Sanitation’s weekly dam levels update.
Would you like to print this page?
print